According to the official data released last Friday, India’s gross domestic product (GDP) contracted by 7.5% during the July, August, and September quarter. This means in Q2 of 2020-21 India produced 7.5% fewer goods and services when compared to what India produced in Q2 of 2019-20.
In the process, India’s economy has now formally entered into a technical recession because — along with the nearly 24% contraction in Q1 — India has had two consecutive quarters when GDP growth rate has declined.
However, the 7.5% decline data has been met with all-round cheers. That is counter-intuitive but not without justification. For one, the 7.5% figure is decidedly lower than most street estimates.
Moreover, this sharper-than-expected economic “recovery” — in a manner of speaking — has substantially changed how the Indian economy is being viewed. The 23.9% fall in GDP in Q1 was one of the worst among the major economies of the world. But the 7.5% contraction is better than the global average. According to an analysis by the State Bank of India’s research team, 49 countries have declared GDP data for the July-Sept quarter. The average decline of these 49 countries is 12.4%. In comparison, India’s 7.5% looks much better. In the previous quarter — that is, April, May, June — the average of these 49 economies was minus 5.6% while India contracted by almost 24%.
The second takeaway is that economic recovery is fairly broad-based. To understand this one must look at the Gross Value Added (GVA) data instead of GDP data. The GVA data provides a measure of national income by looking at the value-added by different sectors of the economy in that quarter. If you want to compare which parts of the economy improved production and incomes from one quarter to another, the GVA is more apt.
Look at the last two columns of Statement 1 (from the government press release) alongside. They show the percentage change in the GVA of each sector when compared to the same quarter in the last financial year (2019-20).
Statement 1: Quarterly estimates of GVA at Basic prices in Q2
First of all, as compared to just one sector adding positive value in Q1, three sectors added positive value in Q2. These were agriculture, manufacturing and utilities (highlighted in green circles).
Moreover, in three of the remaining five sectors, the rate of decline decelerated — highlighted in green boxes.
The third takeaway is in the form of a caveat. The most surprising aspect of Q2 data is the positive growth — albeit a meagre 0.6% — registered by India’s manufacturing industry. Part of this can be explained by a weak base — check out the minus 0.6% in Q2 of 2019-20.
But, even so, most analysts are surprised how India’s manufacturing firms managed to add value in such difficult times. Especially since other markers of such industrial activity performed rather poorly during the same period.
The Index of Industrial Production, for instance, is highly correlated — almost 0.90 — with Manufacturing sector’s GVA and yet “this correlation collapsed in Q2 when IIP manufacturing declined by 6.7% (average of Jul/Aug/Sep) while manufacturing GVA grew by 0.6%,” states an SBI research report.
“We believe one possible reason for this could be stellar Corporate GVA numbers in Q2 on the back of massive purge in costs. Further, we observed small companies, with turnover of up to Rs 500 crore, are more aggressive in cutting cost, displaying reduction in employee cost by 10-12%,” it states further.
In other words, companies increased their incomes not by selling more but by ruthlessly getting rid of employees. This, in turn, could undermine future demand.
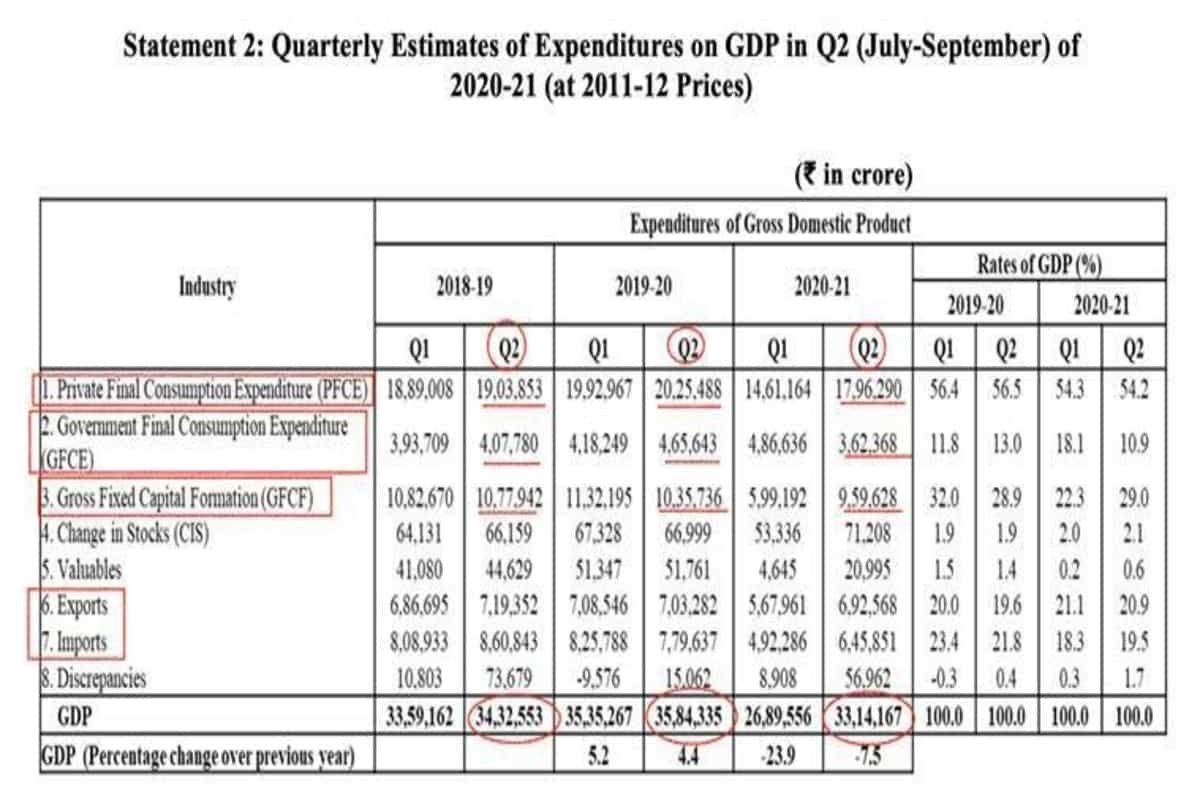
Speaking of lack of demand brings us to the fourth takeaway. If we turn over to the GDP data (see Statement 2) — which measures national income from the perspective of who demanded (spent) how much in a particular quarter — we find that all engines of growth were performing far below normal.
Statement 2: Quarterly Estimates if Expenditures on GDP in Q2
The four engines are highlighted in red boxes. The PFCE refers to what you and I spend on our consumption and this is the biggest engine of demand. This spending — at Rs 17.96 lakh crore — was down 11% in Q2 when compared to Q2 in 2019-20. The GFCF refers to the demand generated by investments made in the economy by the businesses/firms — both big and small. This component is the second biggest engine of growth and — at Rs 9.59 lakh crore — it was 7% less than what it was in Q2 of 2019-20.
Both exports and imports have shrunk but imports have shrunk relatively more than exports and, as such, net exports have improved marginally. But while this provides a boost to aggregate demand in a relative sense, such a sharp fall in import demand does not augur well for a growing economy such as India.
The worst news, however, is that the GFCE or the spending by the government in Q2 is down by over 22% over the same quarter in the last financial year. This underscores the point several critics have raised in the past — that the government is not spending enough to boost economic recovery.
As a result, the Q2’s real GDP in absolute terms is lower than what it was even two years ago.
However, the Q2 GDP data — which is the last such release before the Union Budget is presented on February 1 — points to a trend where India will most probably witness positive growth rate in “nominal” GDP as early as the third quarter, which is currently underway.
That brings us to the fifth key takeaway from this round of GDP data: The importance of nominal GDP especially from the point of view of India’s forthcoming Budget.
Let me explain.
All along this analysis, we have talked about real GDP (and GVA). In other words, the GDP calculated at constant prices (that is, the prices that prevailed in 2011-12). Or, more simply, the GDP after the effect of inflation has been removed from it.
Removing inflation’s effect from “nominal” GDP helps provide the “real” picture of an economy. For example, if prices increased by 10% from one year to another even without there being any increase in the total number of things produced in an economy, the nominal GDP growth rate would be 10%. But the nominal growth rate hides the fact that not a single real thing was added in the second year.
But there is one crucial aspect in which nominal GDP trumps real GDP: In the real world we inhabit, what we observe is nominal GDP (that is, GDP calculated at current prices). The so-called “real” GDP is a derived data. It is ascertained by taking the nominal GDP growth rate and subtracting the inflation rate from it. So, if the observed nominal GDP is 12% and the inflation rate is 4% then economists quickly derive the “real” GDP growth rate as 8%.
More crucially, when the government makes the next year’s Budget, as is happening already, it bases all its calculations — its projected tax collections, its expenditures, its deficits — on nominal GDP.
Statement 4 of the government press release shows the absolute level as well as the growth rate of nominal GDP. As you can see, the nominal GDP growth rate was just minus 4% in Q2. Taken together with an inflation rate (called GDP deflator) of 3.5%, we get a minus 7.5% of real GDP growth rate.
Statement 4 of the government press release shows the absolute level as well as the growth rate of nominal GDP.
Most experts now expect that by Q4, the nominal GDP growth rate will recover so far that even after subtracting inflation rate, India would register positive real growth in at least the fourth quarter.
But it is important to point out that Finance Minister Nirmala Sitharaman — as well as her predecessor, Piyush Goyal — repeatedly got their assumption of nominal GDP growth wrong. This has resulted in massive variance between Budget Estimates and Revised Estimates — or poor “fiscal marksmanship”.
The soundness of the Finance Ministry’s assessment of India’s nominal GDP growth rate in 2021-22 is central to the credibility of the forthcoming Budget numbers.